John W. Davis, MD, FACS, presented “Current Mortality Rates on Prostate Cancer Patients” at the International Prostate Cancer Update on January 27, 2018 in Beaver Creek, Colorado
How to cite: Davis, John W. “Current Mortality Rates on Prostate Cancer Patients” January 27, 2018. Accessed. https://grandroundsinurology.com/Population-Type-Data-on-Radical-Prostatectomy-and-Treatment-Mortality/
Summary:
John W. Davis, MD, FACS, provides an overview of current mortality rates in prostate cancer patients and multiple factors, including methods of prostatectomy, inherent risks, and adverse events to treatments. He also gives his opinions on how the United States Preventive Services Task Force (USPSTF) PSA testing recommendations have affected this data.
Population Type Data on Radical Prostatectomy and Treatment Mortality – Transcript
Click on slide to expand
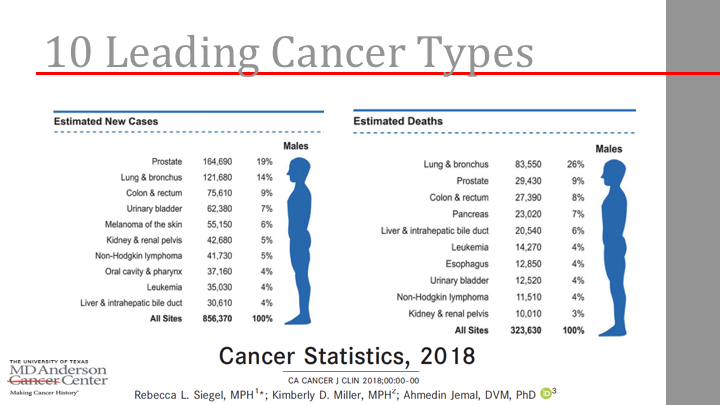
10 Leading Cancer Types
So I thought I would add this to the talk. This paper comes up in publications and those of us who do editorial stuff, we’re happy if a paper gets sited like five times for your journal. That really helps the impact of whatever journal you’re working and I work with British Journal for the editorial stuff. This Jamel paper that comes out every year, it gets like quoted like, I don’t know, a couple of thousand times, like the entire impact of this journal is from the this. It’s out in 2018, prostate you see up there is the number one type of cancer in men, 19% estimated deaths. It’s number two, 29,000. I think that’s been higher in the past. You’ll see the graphs, so 9% overall with lung and bronchus being the number one cause of cancer related mortality.
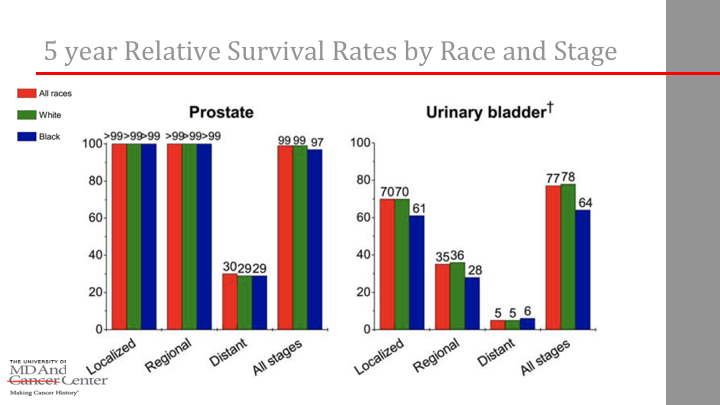
5 year Relative Survival Rates by Race and Stage
And again, it’s interesting again, the diversity of, say, prostate next to the bladder statistic, so if you look over on the left, it’s giving you basically race, which is interesting, but also just sort of a stage base, so if you look at localized prostate cancer, five year survival rate is almost 100%, compare that to bladder where it’s 70. Obviously, there’s a dip when you look at distant metastasis presentation, but all stage is very high, so it’s kind of unique when compared to some of our other GU cancers.

Stage Distribution by Race, Stage
Again, stage distribution by race in terms of localized being higher than regional or distance compared to bladder where there’s a little more spread out of that.
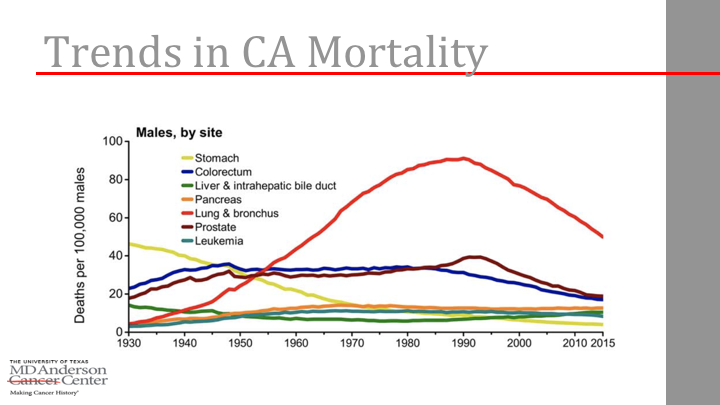
Trends in CA Mortality
So, this is the one we’ve seen for years. The trends in cancer mortality, the prostate line is kind of the maroon one in here and yeah, you look at the dates, so we know the famous PSA spike in the 90’s and it just continues to kind of tail off despite all the fuss about the task force issues.
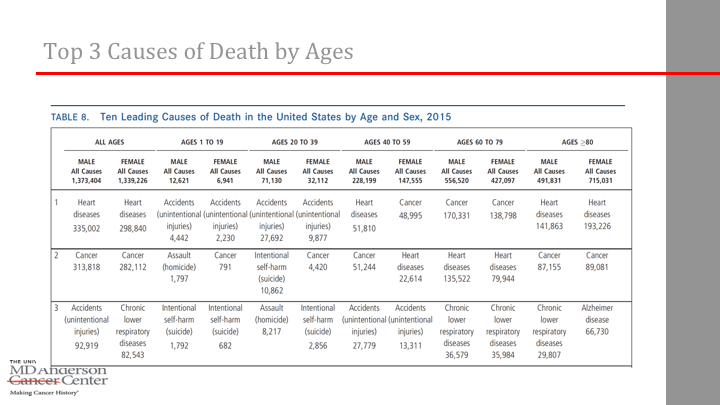
Top 3 Causes of Death by Ages
This is also in the Jamel paper, too. I mean, a lot of us quote and pull slides out of it, but it’s actually an interesting paper to read the whole thing just to have a broad view of cancer statistics, so for example, this table eight, ten leading causes of death in the United States, it’s a busy table, but go over here and look at all ages in men. Number one, heart disease, then cancer, then accidents, but then it breaks it down into age brackets, so for me just one to 19 it’s accidents, assaults and suicides. Makes sense, not as much disease there. If you move over into what we deal with mostly, then in the 60’s to 80’s, then cancer is number one, then heart disease whereas if you go over age 80, then it’s back to heart disease with cancer number two. I’m sure you’ve heard that quoted many times. Most prostate cancer patients are more likely to die of heart disease in most cases.
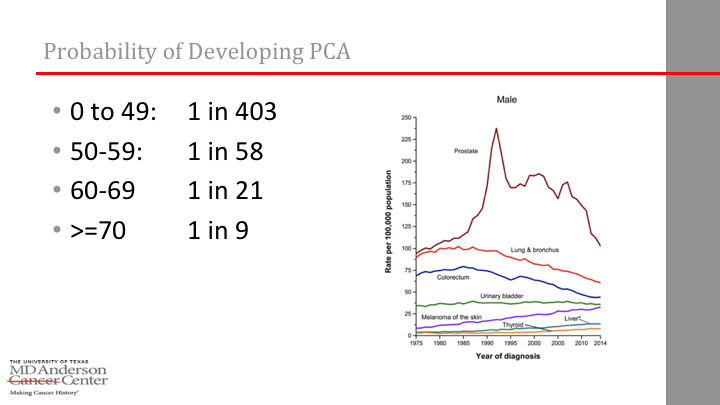
Probability of Developing PCA
And this is kind of the ratios of probability of developing prostate cancer by decades, very low in the under age 50, but then one in nine for over age 70.
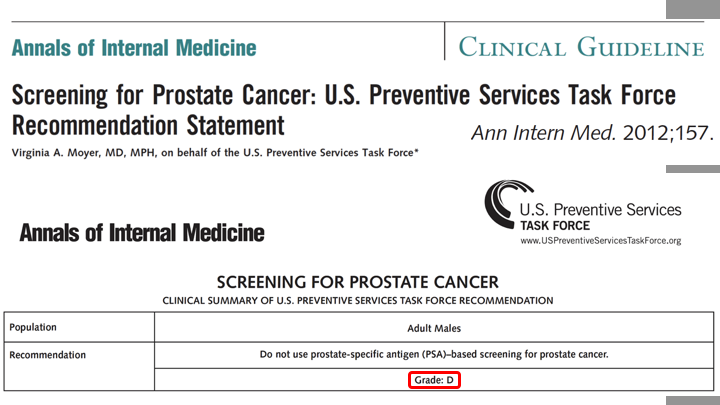
Annals of Internal Medicine
So, then the other thing that got my attention years ago was the course the 2012 task force paper on this, and the evidence reviewed that came out. Obviously, I first drafted this type talk for the August meeting for some of you people who were here for the think tank meeting at the Broadmoor. In earlier, in 2017, the task force actually revised the guidelines from a D to a C, although that still remains in draft. I keep looking at it and wondering why it’s been in draft for almost a year, but maybe somebody will explain. And, of course, so this is what got our attention was 2012 giving a D.

Video Highlights–RARP
Because we know that the screening recommendations do affect our work as surgeons, the longer version of this talk I would take you through video narratives of what happens in the operating room. Yes, we can diagnose and treat too early, typical illustration being an elderly patient with low grade disease, mostly with BPH aggressively biopsied with fusion MRI to find Gleason 6 and yes, some of them will insist on therapy and sometimes they do get upgraded, the case I would do like get one from 3 3 or 3 4. And then there’s the too late. I had a recent case of a 58 year old with family history, African American, never screened until 58 and the first PSA he ever drew was 28, 12 cores of Gleason 7, of course, aggressive pathology and postop hormonal therapy type things and then of course, you do hit it right, 45 year old with family history, Gleason 7 contained. No controversy at all, and excellent functional results. It’s obviously easier to get that out of a 45 year old.

Harms of Treatment
But we know there’s harms of treatment. This is a quote out of the 2012 task force. “Adequate evidence shows that nearly 90% of men with PSA detected prostate cancer in the United States have early treatment of surgery, radiation, or androgen deprivation” and yes, the revised guidelines show that we have taken a dent out of some of that number. I’m not sure if it’s Scott or someone had that in their slide. I didn’t catch it. I don’t know what the 90% dropped to, but someone tell me if you’ve seen that. And here’s one that got my attention too was, because I never knew this going through residency because I was sort of a 90’s trainee, you know, open surgery, knowing that laparoscopy was coming. So, I had to kind of retrofit my fellowships around minimally invasive. At the time they said, I don’t know why they said 5 in 1000 men will die of prostate surgery within a month.
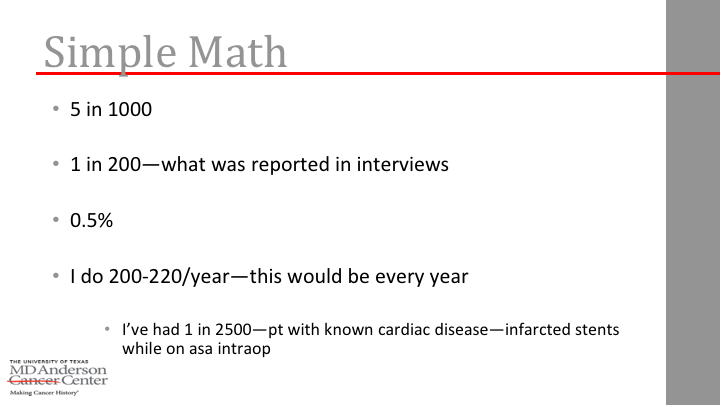
Simple Math
I don’t know why they said five because I can do math, even though I have kids that have gone through calculus, so five in 1000 can also be expressed as one in 200, right? So, or 0.5%. It’s amazing what you can do with a napkin and a pin, so I do 200 to 220 a year, so if that were true, I would have a death every year and that would be depressing, and I would probably find something else to do, actually. So, I’ve actually only had one in 2500 and he was a cardiac guy with stents, passed all of his tests and he infarct with him on the table and we absolutely could not get him back. It was terrible. So, it kind of sparked my interest as to where that data came from.
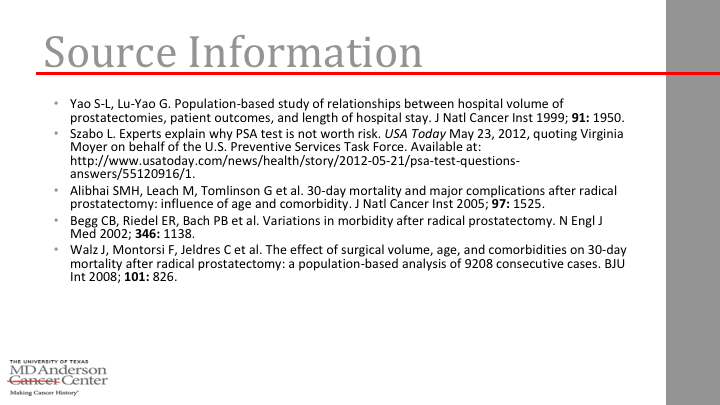
Source Information
And if you looked at the source data, it’s mostly 1990’s Medicare kind of data and it probably was true if people were doing a lot of open surgery in older men with blood loss and all the transfusions. Do you remember those famous stats like when people would re-certify for the American Boards in the ’90’s, the average index case log for RP was like 20 cases a year and I think one side from J. Smith it was 0.8 cystectomies in their research? I don’t know how you do 0.8% of a cystectomy, but anyway. So, now, I mean the robots, if it’s changed anything, it’s changed the fact that most people either do say 50 a year or they kind of like do none, especially in large group urology practices have an influence. There’s much more specialization now.
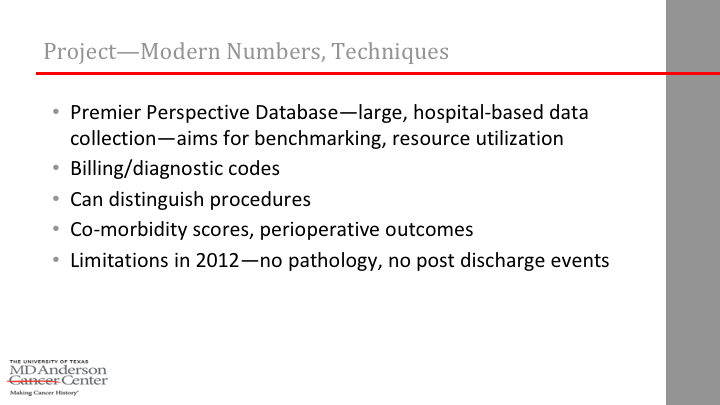
Project-Modern Numbers, Techniques
So, a project came across my radar of people asking me to help them analyze this data. It was, at the time we have never heard of it, but it’s in the literature now. It’s called premiere perspective data set, a large hospital based data collection mainly used for benchmarking and resource utilization. Actually, I just learned at last year’s AUA that when Medicare wanted to kind of recode some of the issues around robotic prostatectomy, the premiere data set was one of the sources they used to kind of look at how effort and coding should go. It can distinguish procedures really well because it knows what you’re spending money on. Some of the early minimally invasive papers, a laparoscopic and a robotic code was the same, so you couldn’t differentiate them. Premiere can see the difference. It has a comorbidity score, but oddly enough, it has no path data, so you can’t like correct for that, so it, you have to take its strengths and limitations.
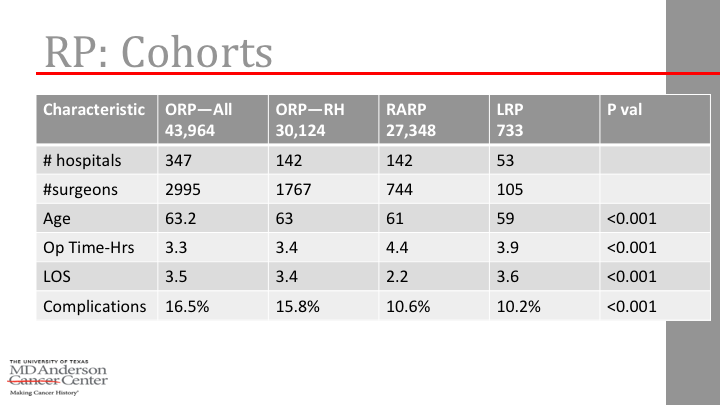
RP: Cohorts
And early on you couldn’t capture a discharge data, but we ran some numbers on it and kind of what’s available of interest is sort of ORP open hospital or open radical prostate at any hospital 43,000 patients, 347 hospitals, complication rate 16.5%. He didn’t get basic outcomes like number of surgeons, age, op time, length of stay, so you can do kind of like a learning curve paper and I put that into a journal a few years back. Then you can separate open prostatectomy done at hospitals that actually have a robot. We have always kind of wondered is there a difference in skill set or bigger hospitals more likely to have a robot and maybe they’re better at doing the opens as well or may not. Occupational therapy a big difference in that and then there’s of course the robot and the laps. I always assume the laps are all geriandreal by themselves, so, right? Are you hiding somewhere like, not that many by comparison. So, there were fewer complications. It’s a little bit of a longer operation. Other things are quite similar, actually.
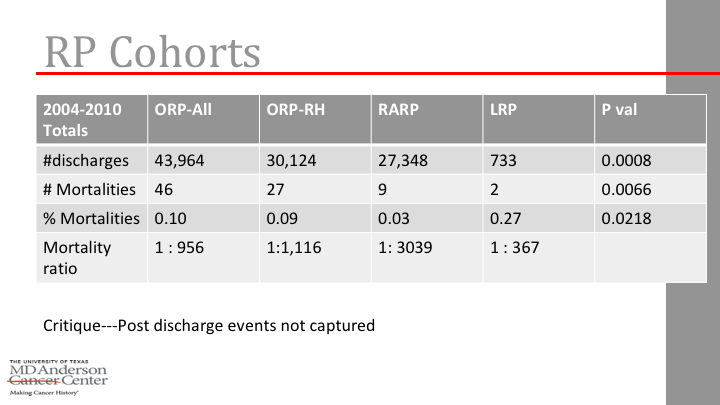
RP: Cohorts
We went through discharges and mortalities. Basically, we were getting for open ratio instead of one in 200, it was basically around one in 1000. Robotic was one in 3000 and then lap one in 346 in a small sample size. So, those are very different numbers, but it was a fair statement in peer review that if someone went home and died, this data set wasn’t really designed to capture it when we ran these numbers in 2012ish. So, we kind of just sat there in abstract form, so we just published the learning curve complication part of that.
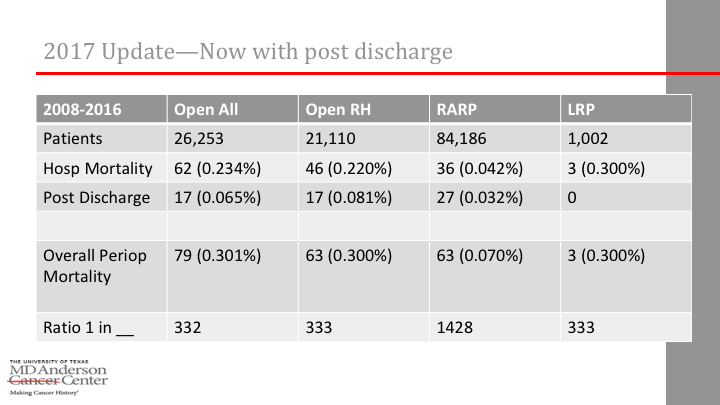
2017 Update-Now With Post Discharge
Now, last summer, though, the data set now can capture data sets, because at the time I was trying to find anyone who had published a ratio of let’s say if you have, let’s say you have a statistic of 30 day mortality, do you actually know what percent was in hospital versus out and I couldn’t find a stat anywhere. So, I would be making up. So, here we ran it, so, and the number’s a little bit different because now with more updating, obviously, there’s fewer opens and even more robots in the same area, much higher on the robotics. But overall, you see lower ratios, but one in 332 for open, one in 1428 for surgery.
Post discharge, you see that it does account, so like here’s the hospital mortality from these 62 hospitals, 17 postop, so there is almost maybe a third, 36 for robotic 27 post discharge, so it turned out not to be a minor issue of missing the post discharge, DVT’s, sudden MI’s or whatever it is that would get you out of the hospital, but then have a mortality. So, we’ll try to dissect it. We’re going to try to do a propensity analysis. It’s just hard because you don’t have great pathologic data. We can do some on comorbidities and age and things like that.

Issues Following Prostate Cancer Treatment
The other little assortment that I presented also I wanted to share. Chris Wallis has done a lot of work on mortality statistics that are interesting, focusing a little bit on radiation and actually, I had to sit in on his Ph.D. thesis. They have like an external advisory board, so I was on the phone listening to him talk for like two or three hours with all the board and all this stuff and have to do a written review of the slides. That was a great experience, so I’m so, he had kind of the vague title of issues following prostate cancer treatment. He kind of put three projects together. I sort of helped him rename all of that.

European Urology
And some of what he’s done structurally is already in the literature you can look at, so for example, he’s done the analysis of putting together all the systematic review of surgery versus radiotherapy and population based data and people love batting that around now that we have the protect trial and different populations. I won’t get into that today. A new one just came out as well on survival and complications, again, highlighting differences and surgical versus long term complications of radiotherapy, so, worth looking at.

Overview
For the Ph.D., though, he did a little bit of an MR and A project.
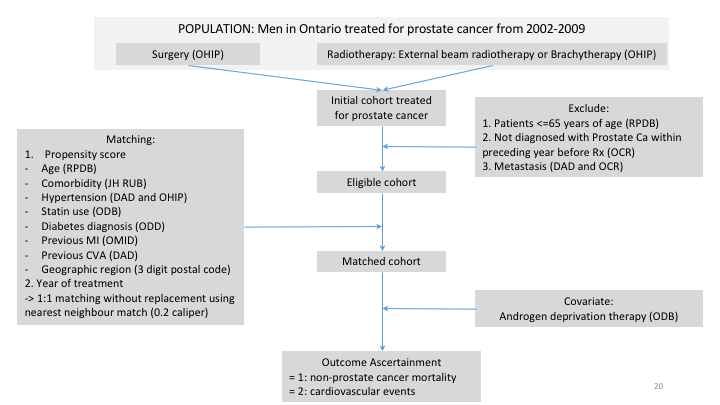
Population: Men in Ontario Treated for Prostate Cancer from 2002-2009
But, then he dove into this Ontario data set where specifically looking at mortality rates after radiotherapy, even with the ability to control for androgen deprivation, so you go through the whole busy structural set up of how to get a population data set together and do a propensity analysis, and as it came up in the committee discussion on it, people either love these or hate them. Some people think propensity fixes everything, some people say its flawed, no matter what.
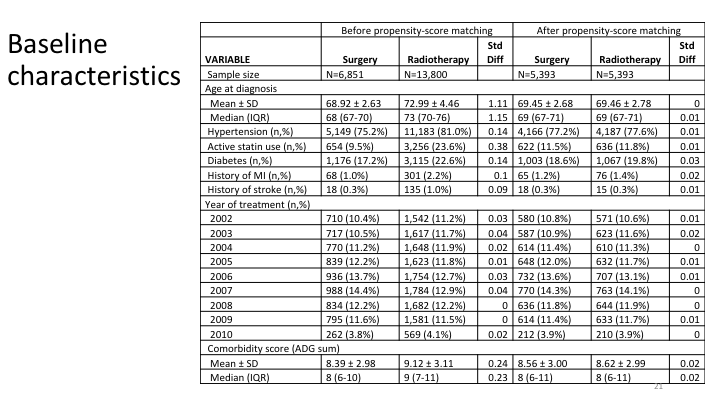
Baseline Characteristics
And so it’s very structurally. You have to pick out all of your variables and it’s obviously very statistically driven.
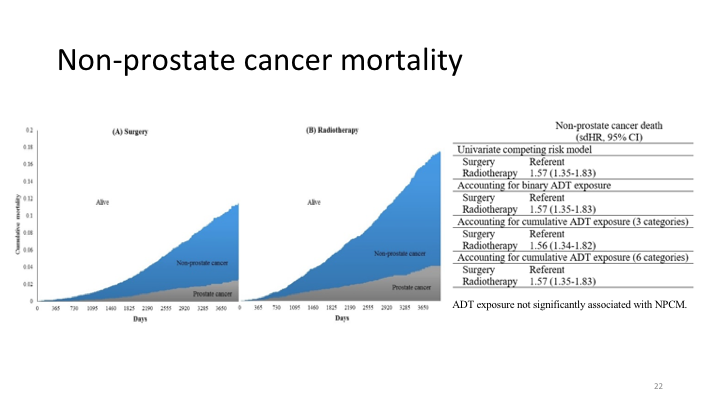
Non-Prostate Cancer Mortality
So, non-prostate cancer mortality. On the left is surgery, on the right is radiotherapy, and you see a slight increase in mortality long term of radiated patients even after correcting for androgen deprivation use. You can drill it down on some of it being cardiac mortality, some of it being ischemic events, so I’m just giving you highlights. This part has been, he’s presented and talked about at various meetings, but it’s still I’ve not seen it published out yet.
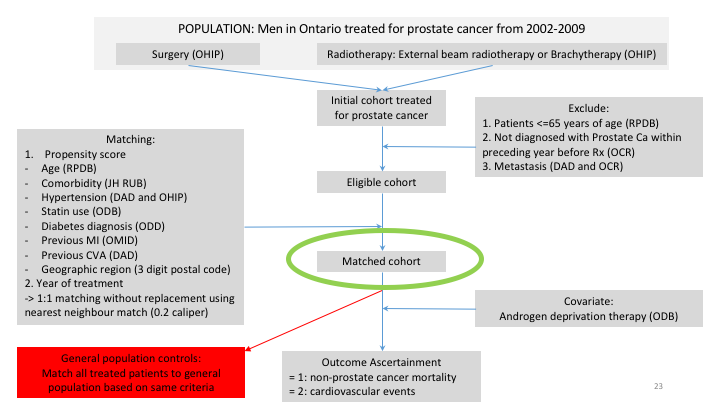
Population: Men in Ontario Treated for Prostate Cancer from 2002-2009
And yes you can then match it to population controls, people without cancer and see kind of the same curves.
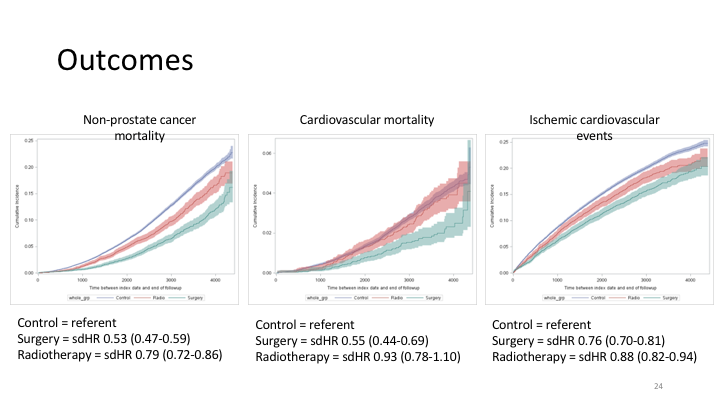
Outcomes
Non-prostate mortality, cardiovascular, ischemic events, so obviously the timing of this is very different. Surgery you’re talking about someone typing you suddenly during surgery or certainly thereafter versus ten years later based on a cardiac event or what have you, but, still part of it.

Bladder Cancer
The other part that’s just interesting is not necessary mortality, but it could be sort of the systematic review of secondary cancers, so we looked at all the issues of bladder cancer favoring more cancers over the future.

Colorectal Cancer
Colorectal cancers.
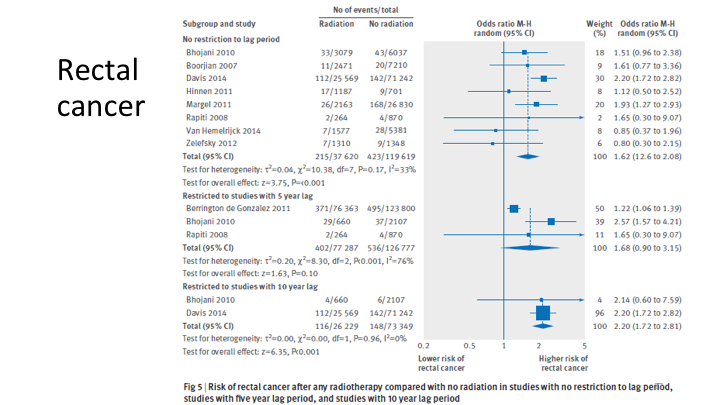
Rectal Cancer
Rectal cancer and then I don’t have it on the slide, but lung was the control population, that was a negative.

Conclusions
So, their conclusion was radiotherapy for prostate cancer increases the risk of secondary malignancies within the radiotherapy filed, but not outside of it, and they had enough data to propose that.

The New Recommendations for Prostate Cancer Screening are a Bad Deal
So, the concluding part of all this, because it’s kind of fun, you know in this new age of social media and twitter, without even going to a meeting you can have rapid access to all sorts of opinions, so kind of a famous social media guy is some medical oncologist named Vinay Prasad. It’s funny at the same meeting in August, both me and Andrew had, we quoted him for different reasons. He’s got a whole essay on the screening recommendations under the philosophy and you can read this.
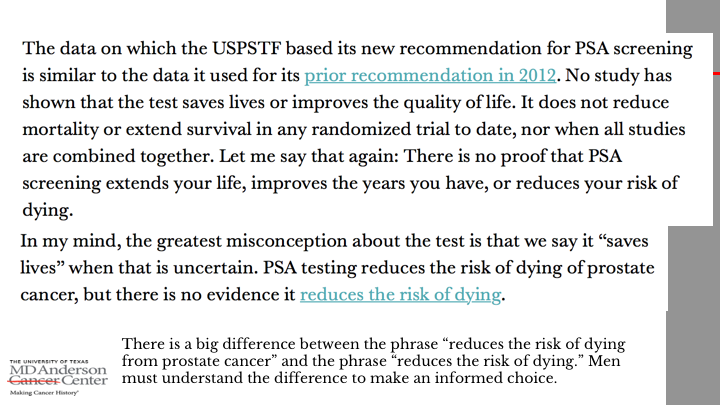
The New Recommendations for Prostate Cancer Screening are a Bad Deal
But on the bottom I’ll just highlight, there’s a big difference between the phrase that screening might reduce the risk of dying from prostate cancer versus the phrase reduces the risk of dying. So it’s a whole overall cancer specific versus overall. So, men must understand that yes, even though the biomarker driven screening, you could reduce cancer mortalities if we then have treatment related mortalities short term or long term. If you think about the numbers, you can almost undo some of the gains that we are also happy about with screening programs, so, it’s important for us to identify treatment related causes of mortality and try to minimize this much in part. At least the good news is, as compared to the initial uptake of open proctectomy in the 90’s, all those mortality statistics are better for open as robotic surgeons, I love saying that clearly the lowest incidences, robotic for whatever reason. So those are my conclusion points.
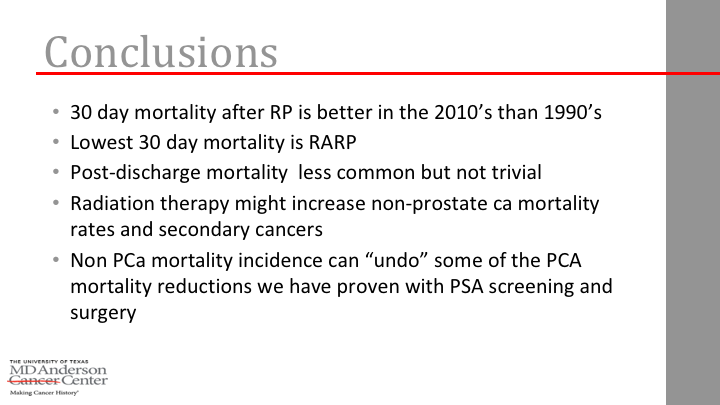
Conclusions
So those are my conclusion points.